MAGAZINE
ルーターマガジン
Chart.jsのバージョン別変更点まとめ:2系から4系移行時の注意点

はじめに
こんにちは。エンジニアのmiyakawaです。
前回のブログでは、Web上でグラフでデータを伝える手法としてChart.jsを説明しました。
前回のブログではChart.jsのメジャーバージョン4(4.x)の説明をしていました。Chart.jsはバージョンが異なることで、オプション設定のなどが変化します。例えば、Chart.jsのバージョン2.9.4で、前回のブログのHTMLを読み込みしても、オプションが動作せずに、設定しているグラフが描画できていません。

バージョンの違いによる問題で上手くChart.jsを使用できない、もしくはバージョンアップをする場合など、まとまった情報が欲しいと考えました。
そこで、バージョンが異なるChart.jsはどのオプションの差分を確認していきます。メジャーバージョン4に対して、メジャーバージョン2とメジャーバージョン3の差分を見ていきます。
使用するChart.jsのバージョン
今回は以下のChart.jsのバージョンを使用して、前回のブログ同様のグラフを作成し、その差分を比較していきます。
- 2.9.4
- 3.9.1
- 4.4.4
実装前の準備
前回のブログ同様にCDNを使用して、Chart.jsを呼び出します。
また、前回のブログと同様に、luxonを使用してChart.jsで日付を扱っていきます。
Chart.jsの4.xと3.xのバージョンごとの違い
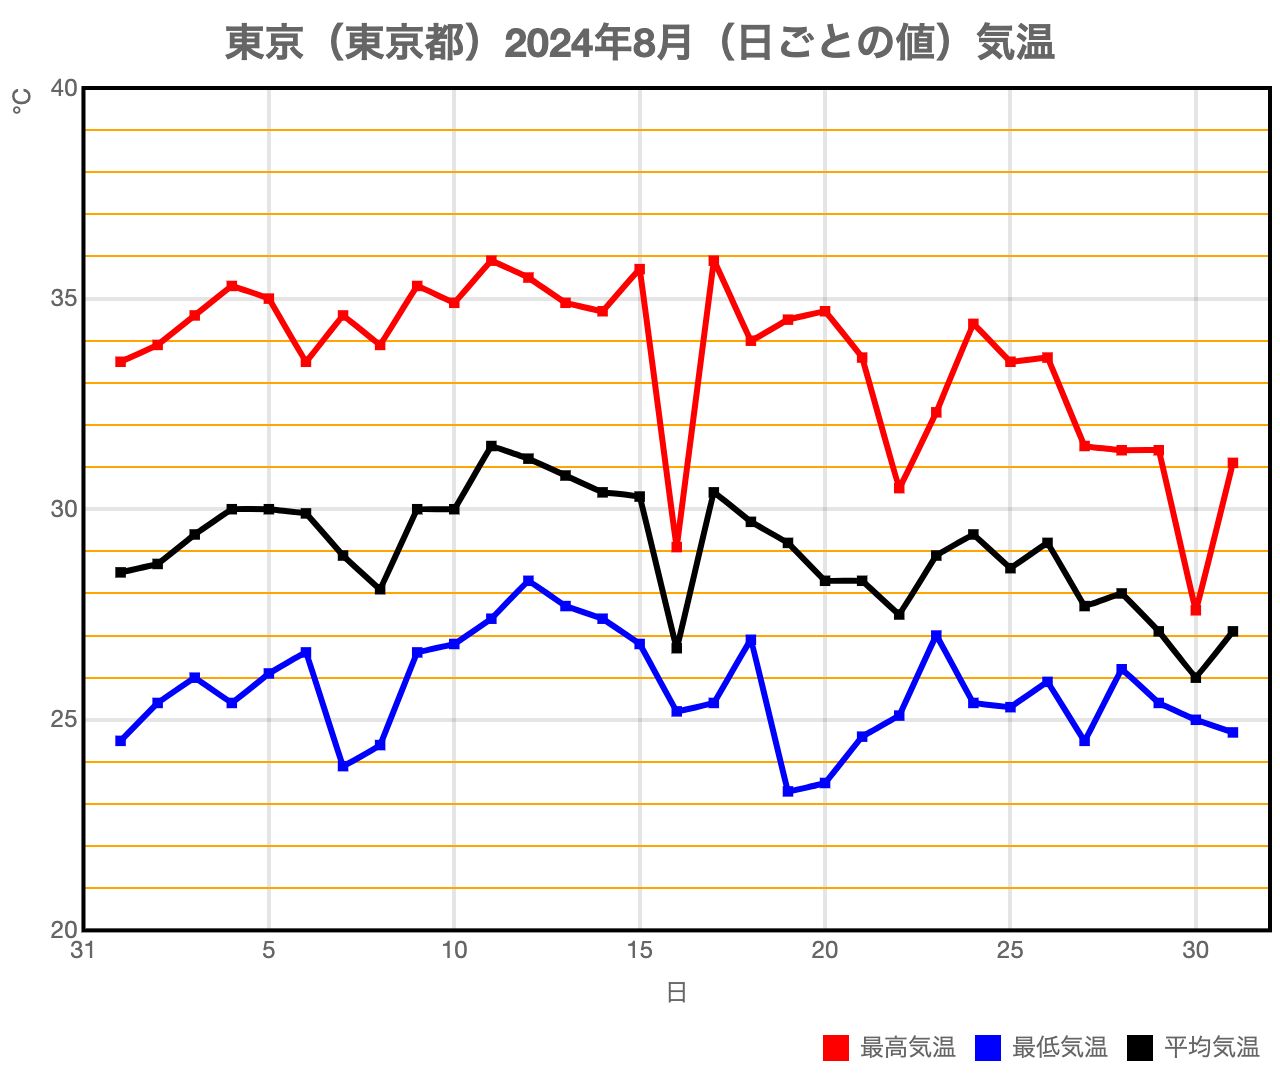
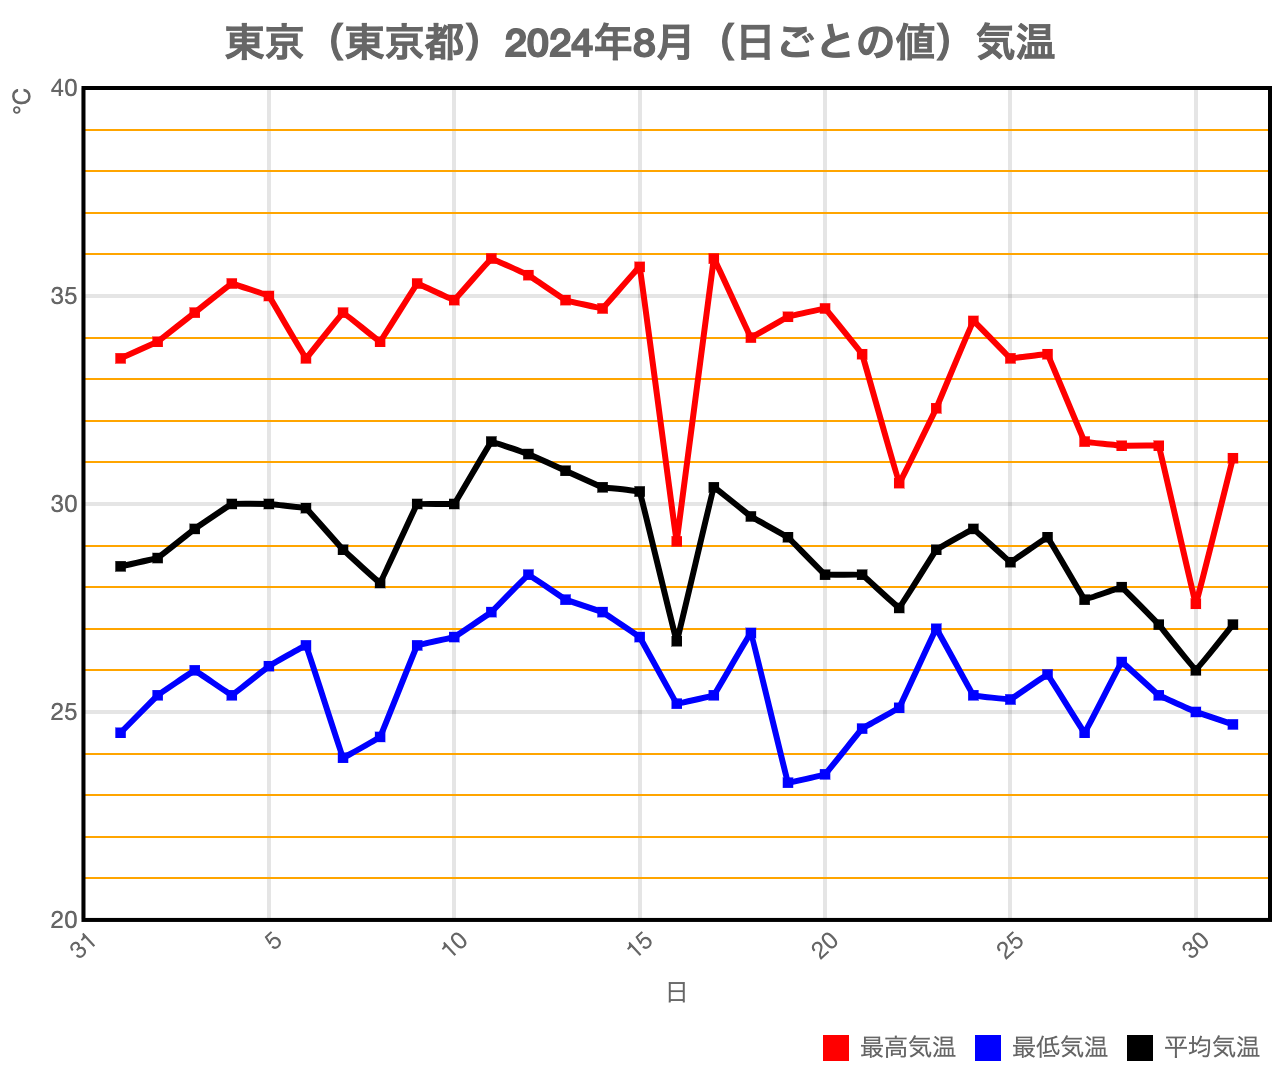
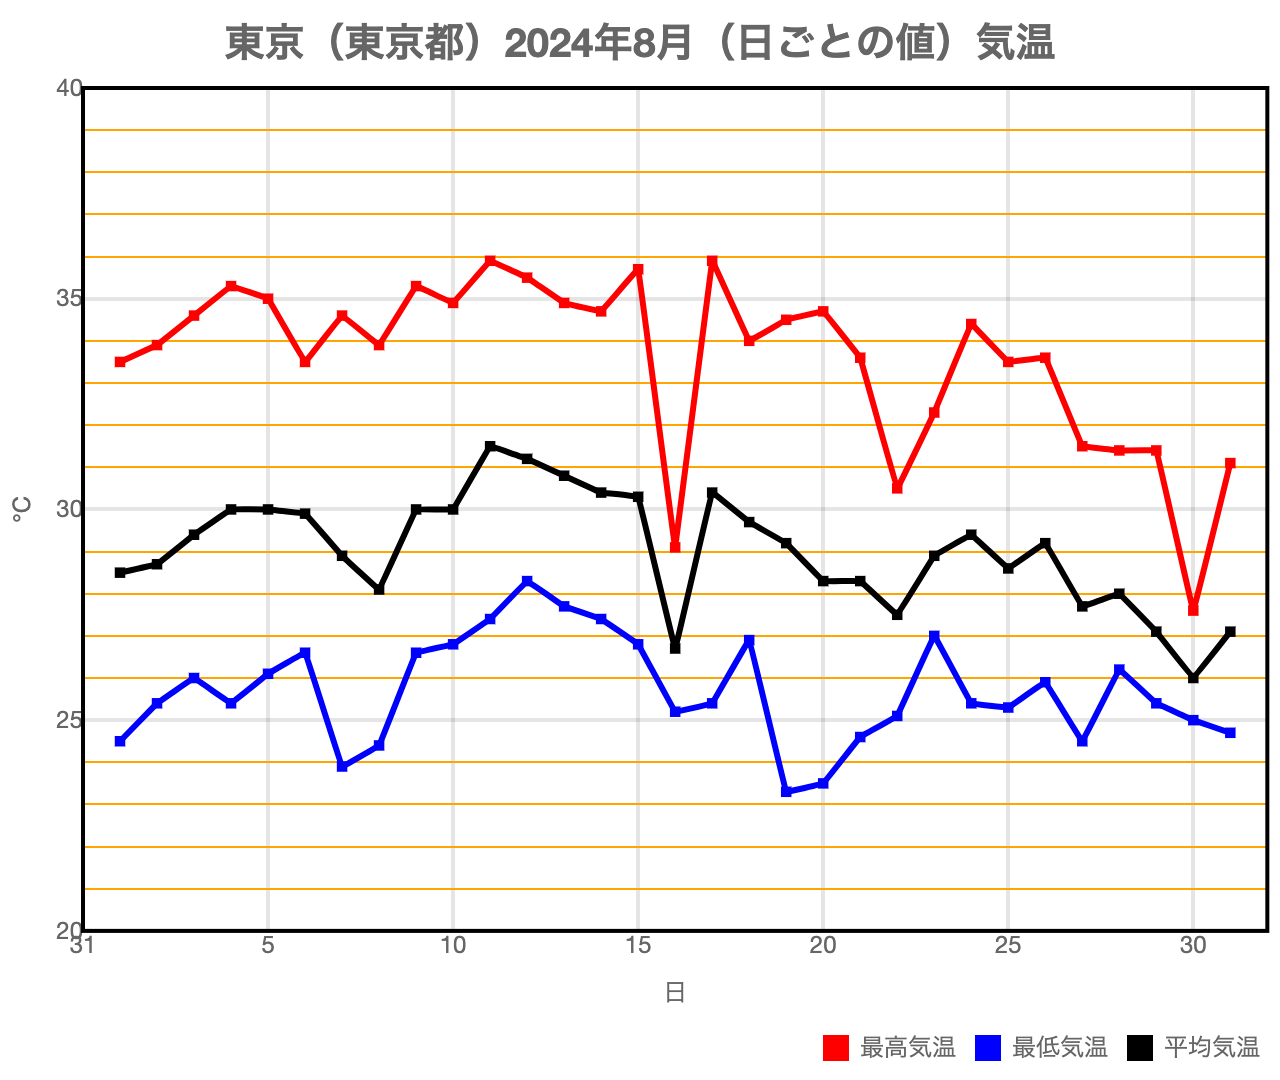
初めに、Chart.jsの4.4.4と3.9.1でどのような差分があるか見ていきます。前回のブログで作成したHTNLの呼び出すChart.jsのバージョンを4.4.4から3.9.1に変更します。以下に、4.4.4でのグラフと3.9.1に変更した場合のグラフになります。


上記2つのグラフの差分は、X軸の目盛りの数値が、回転していることになります。X軸の目盛りの回転は、X軸のticksのmaxRotationパラメータを0に設定することで修正できます。
const xTicks = {
  maxTicksLimit: 7,
  maxRotation: 0
};
以上から、線グラフではバージョン4.4.4と3.9.1の差分は、ほとんどないと言えます。
Chart.jsの4.x.xのバージョンごとの違い
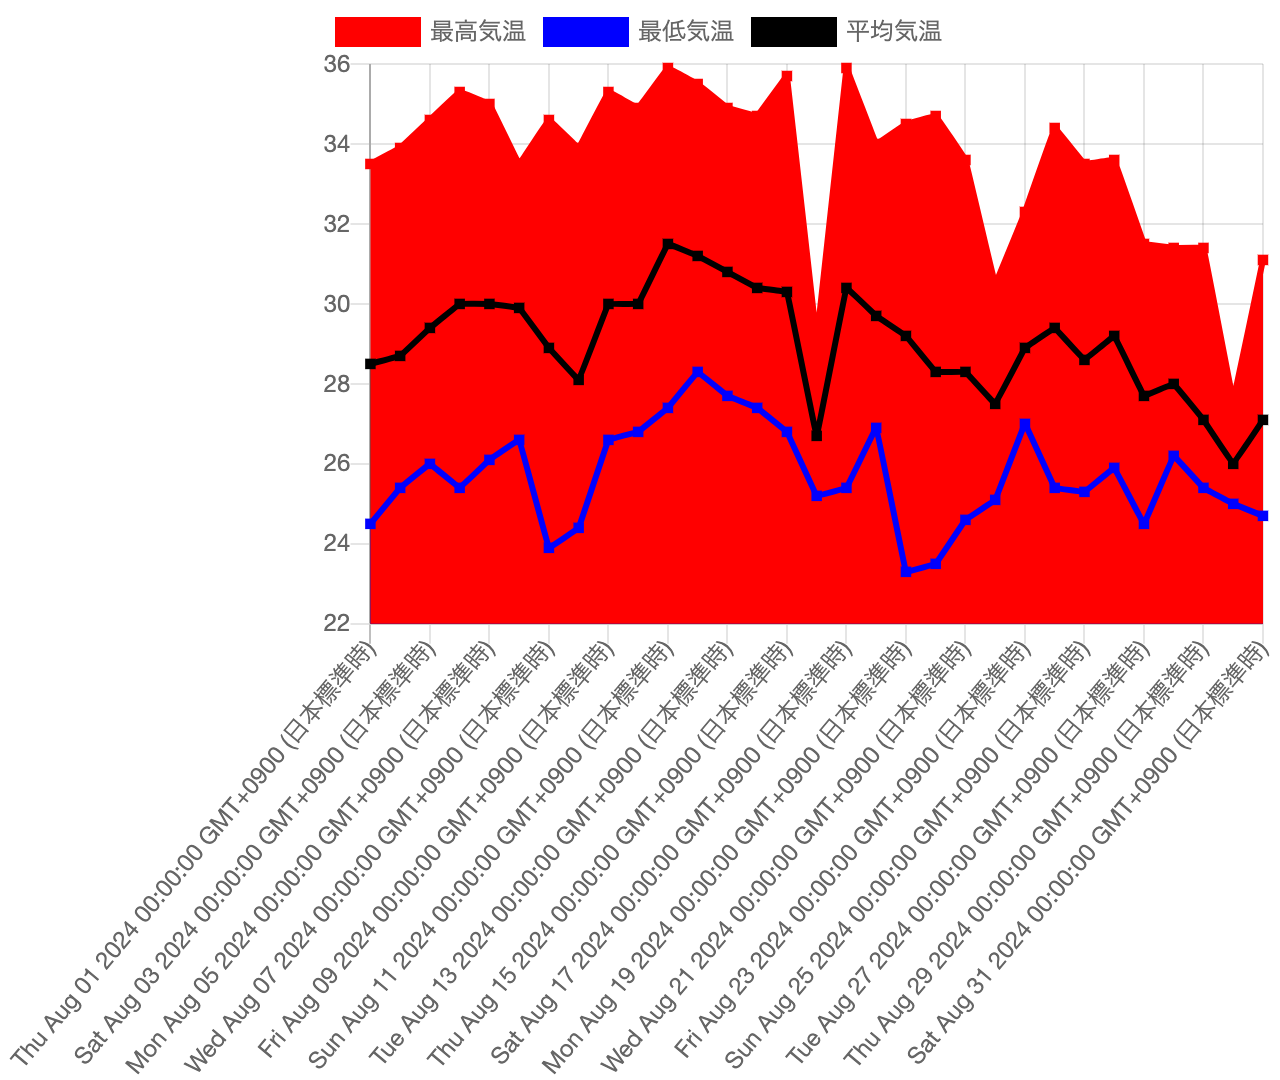
冒頭でも紹介した通り、バージョン4.4.4のChart.jsのコードでは、バージョン2.9.4にグラフを描画させることはできません。もしバージョン2.9.4を動作させる場合は以下のようにHTMLを書き換える必要があります。
<!DOCTYPE html>
<html>
  <head>
    <script src="https://cdn.jsdelivr.net/npm/chart.js@2.9.4/dist/Chart.min.js"></script>
    <script src="https://cdn.jsdelivr.net/npm/luxon@3.5.0/build/global/luxon.min.js"></script>
    <script src="https://cdn.jsdelivr.net/npm/chartjs-adapter-luxon@1.3.1/dist/chartjs-adapter-luxon.umd.min.js"></script>
    <script>
      const dateList = ["2024/08/01" ,"2024/08/02" ,"2024/08/03" ,"2024/08/04" ,"2024/08/05" ,"2024/08/06" ,"2024/08/07" ,"2024/08/08" ,"2024/08/09" ,"2024/08/10" ,"2024/08/11" ,"2024/08/12" ,"2024/08/13" ,"2024/08/14" ,"2024/08/15" ,"2024/08/16" ,"2024/08/17" ,"2024/08/18" ,"2024/08/19" ,"2024/08/20" ,"2024/08/21" ,"2024/08/22" ,"2024/08/23" ,"2024/08/24" ,"2024/08/25" ,"2024/08/26" ,"2024/08/27" ,"2024/08/28" ,"2024/08/29" ,"2024/08/30" ,"2024/08/31"];
      const dateLabels = dateList.map( (date) => new Date(date));
      let dateMaxTemprature = [33.5, 33.9, 34.6, 35.3, 35, 33.5, 34.6, 33.9, 35.3, 34.9, 35.9, 35.5, 34.9, 34.7, 35.7, 29.1, 35.9, 34, 34.5, 34.7, 33.6, 30.5, 32.3, 34.4, 33.5, 33.6, 31.5, 31.4, 31.4, 27.6, 31.1];
      let dateMinTemprature = [24.5, 25.4, 26, 25.4, 26.1, 26.6, 23.9, 24.4, 26.6, 26.8, 27.4, 28.3, 27.7, 27.4, 26.8, 25.2, 25.4, 26.9, 23.3, 23.5, 24.6, 25.1, 27, 25.4, 25.3, 25.9, 24.5, 26.2, 25.4, 25, 24.7];
      let dateAverageTemprature = [28.5, 28.7, 29.4, 30, 30, 29.9, 28.9, 28.1, 30, 30, 31.5, 31.2, 30.8, 30.4, 30.3, 26.7, 30.4, 29.7, 29.2, 28.3, 28.3, 27.5, 28.9, 29.4, 28.6, 29.2, 27.7, 28, 27.1, 26, 27.1];
    </script>
    <script>
      titleOption = {
        display: true,
        text: "東京(東京都)2024年8月(日ごとの値)気温",
        fontSize: 20
      };
      legendOption = {
        position: 'bottom',
        align: 'end',
        labels: {
          usePointStyle: true
        }
      };
      const yMinRange = 20;
      const yMaxRange = 40;

      const xGrid = {
        drawTicks: false,
        lineWidth: 2,
      };
      const xTicks = {
        min: new Date("2024/07/31"),
        max: new Date("2024/09/01"),
        maxTicksLimit: 7,
        maxRotation: 0
      };
      const xUnit = {
        display: true,
        labelString: '日'
      };
      const yGrid ={
        drawTicks: false,
        color: (() => {
          colors = [];
          for (let i = yMinRange; i <= yMaxRange; i++) {
            colors.push(i % 5 == 0 ? Chart.defaults.borderColor : 'orange');
          }
          return colors;
        })(),
        lineWidth: (() => {
          lineWidths = [];
          for (let i = yMinRange; i <= yMaxRange; i++) {
            lineWidths.push(i % 5 == 0 ? 2 : 1)
          }
          return lineWidths;
        })()
      };
      const yTicks ={
        min: yMinRange,
        max: yMaxRange,
        stepSize: 1,
        callback: function(value, index, ticks) {
          return value % 5 == 0 ? value : '';
        }
      };
      const yUnit = {
        display: true,
        labelString: '℃'
      };
      chartAreaBorderOptions = {
        borderColor: 'black',
        borderWidth: 2,
        borderDash: [],
        borderDashOffset: null,
      };
    </script>
    <script>
      const chartAreaBorder = {
        id: 'chartAreaBorder',
        afterDraw(chart, args, options) {
          const {ctx, chartArea: {bottom, left, right, top}} = chart;
          ctx.save();
          ctx.strokeStyle = options.borderColor;
          ctx.lineWidth = options.borderWidth;
          ctx.strokeRect(left, top, right - left, bottom - top);
          ctx.restore();
        }
      };
    </script>
  </head>
  <body>
    <div style="width: 640px; height: 540px;">
      <canvas id="weather-chart"></canvas>
    </div>
    <script>
      const ctx = document.getElementById('weather-chart').getContext('2d');
      const weatherChart = new Chart(ctx, {
        type: 'line',
        data: {
          labels: dateLabels,
          datasets: [
            {
              label: '最高気温',
              data: dateMaxTemprature,
              borderColor: 'red',
              backgroundColor: 'red',
              fill: false,
              pointStyle: 'rect',
              tension: 0.02
            },
            {
              label: '最低気温',
              data: dateMinTemprature,
              borderColor: 'blue',
              backgroundColor: 'blue',
              fill: false,
              pointStyle: 'rect',
              tension: 0.02
            },
            {
              label: '平均気温',
              data: dateAverageTemprature,
              borderColor: 'black',
              backgroundColor: 'black',
              fill: false,
              pointStyle: 'rect',
              tension: 0.02
            }]
        },
        options: {
          maintainAspectRatio: false,
          title: titleOption,
          legend: legendOption,
          plugins: {
            chartAreaBorder: chartAreaBorderOptions,
          },
          scales: {
            xAxes: [{
              type: 'time',
              time: {
                unit: 'day',
                displayFormats: {
                  day: 'd'
                }
              },
              gridLines: xGrid,
              ticks: xTicks,
              scaleLabel: xUnit
            }],
            yAxes: [{
              gridLines: yGrid,
              ticks: yTicks,
              scaleLabel: yUnit
            }],
          },
        },
          plugins: [
            chartAreaBorder
          ]
      });
    </script>
  </body>
</html>
ここで、4.4.4と2.9.4の差分を表にしました。
| 変更箇所 | バージョン 4.4.4 | バージョン 2.9.4 |
|---|---|---|
| グラフ線の塗り潰し | data.datasetsのfillがデフォルトでfalse | data.datasetsのfillがデフォルトでtrue |
| グラフタイトル | options.titleから設定 | options.plugins.titleから設定 |
| 凡例 | options.legendから設定 | options.plugins.legendから設定 |
| フォントサイズの指定 | font.sizeで指定する | fontSizeにて指定する |
| X軸、Y軸の指定 | options.scales[scaleId]を渡す | options.scales.xAxes.id、options.scales.yAxes.idを渡す |
| 格子線 | options.scales[scaleId]のgridにオブジェクトを渡す | X軸、Y軸idのgridLinesにオブジェクトを渡す |
| 格子線の色と線の太さ | 関数で作成できる | 配列で指定できる |
| 最小値、最大値 | options.scales[scaleId]のmin、maxに数値を渡す | X軸、Y軸のticksにmin、maxの数値を渡す |
| 目盛りの数値の回転 | 特に指定なし | X軸、Y軸のticksのmaxRotationを設定する |
| X軸、Y軸単位 | options.scales[scaleId].titleのtitleにて設定できる | X軸、Y軸idのscaleLabelのlabelStringにて設定できる |
| X軸、Y軸単位の位置設定 | titleのalignにて設定できる | 設定できない |
| チャートから取得できる位置とサイズ情報 | 全て取得できる | 位置だけ取得できる |
それぞれの変更点を挙げていきます。
グラフ線の塗り潰し
バージョン4.4.4では、特に指定する必要はありませんでしたが、バージョン2.9.4では、線グラフの下を塗りつぶす機能がデフォルトになっているため、設定を外す必要があります。
// 4.4.4の場合
datasets: [
{
  label: '最高気温',
  data: dateMaxTemprature,
  borderColor: 'red',
  backgroundColor: 'red',
  fill: false,
  pointStyle: 'rect',
  tension: 0.02
},
{
  label: '最低気温',
  data: dateMinTemprature,
  borderColor: 'blue',
  backgroundColor: 'blue',
  fill: false,
  pointStyle: 'rect',
  tension: 0.02
},
{
  label: '平均気温',
  data: dateAverageTemprature,
  borderColor: 'black',
  backgroundColor: 'black',
  fill: false,
  pointStyle: 'rect',
  tension: 0.02
}]

// 2.9.4の場合、datasetsのオブジェクトにfill: falseを設定する必要がある
datasets: [
{
  label: '最高気温',
  data: dateMaxTemprature,
  borderColor: 'red',
  backgroundColor: 'red',
  fill: false,
  pointStyle: 'rect',
  tension: 0.02
},
{
  label: '最低気温',
  data: dateMinTemprature,
  borderColor: 'blue',
  backgroundColor: 'blue',
  fill: false,
  pointStyle: 'rect',
  tension: 0.02
},
{
  label: '平均気温',
  data: dateAverageTemprature,
  borderColor: 'black',
  backgroundColor: 'black',
  fill: false,
  pointStyle: 'rect',
  tension: 0.02
}]
グラフタイトル、凡例
この2つはバージョン4.4.4では、options.pluginsにて設定できますが、2.9.4ではoptionsで指定できます。
// バージョン4.4.4の場合
options: {
  plugins: {
    title: titleOption,
    legend: legendOption,
  }
}

// バージョン2.9.4では、options配下で設定する
options: {
  title: titleOption,
  legend: legendOption,
}
フォントサイズの指定
細かい箇所ではありますが、フォントのサイズを指定する際も異なります。
// バージョン4.4.4の場合
font: {
  size: 20
}

// バージョン2.9.4では、fontSizeという1つの塊になる
fontSize: 20
X軸、Y軸の指定
バージョン4.4.4では、options.scales[scaleId]にオブジェクトを渡すします。バージョン2.9.4では、options.scales.xAxes、options.scales. yAxesに配列をわたすことで、X軸Y軸を設定します。
// バージョン4.4.4の場合
options: {
  scales: {
    x: {...},
    y: {...}
  }
}

// バージョン2.9.4の場合はxAxesとyAxesに配列を渡す
options: {
  scales: {
    xAxes: [{...}],
    yAxes: [{...}]
  }
}
格子線の設定
バージョン4.4.4では、gridに設定します。また、格子線の太さや色はscriptable設定があり、関数を使用して設定できます。 バージョン2.9.4では、gridLinesに設定します。格子線の太さや色は、関数を使用して設定できません。代わりに配列で、個別に色や太さを設定することはできます。
// バージョン4.4.4の場合
y: {
  grid: {
    color: function(tick) {
      return tick['tick']['value'] % 5 == 0 ? Chart.defaults.borderColor : 'orange';
    },
    lineWidth: function(tick) {
      return tick['tick']['value'] % 5 == 0 ? 2 : 1;
    },
  }
}

// バージョン2.9.4の場合は、配列で渡す必要あり、かつ色や線の太さは配列でしか渡せない
yAxes: [{
  gridLines: {
    color: (() => {
      colors = [];
      for (let i = yMinRange; i <= yMaxRange; i++) {
        colors.push(i % 5 == 0 ? Chart.defaults.borderColor : 'orange');
      }
      return colors;
    })(),
    lineWidth: (() => {
      lineWidths = [];
      for (let i = yMinRange; i <= yMaxRange; i++) {
        lineWidths.push(i % 5 == 0 ? 2 : 1)
      }
      return lineWidths;
    })()
  }
}]
目盛り線の設定
バージョン4.4.4では最大値と最小値は、options.scales[scaleId]にて設定しています。バージョン2.9.4では、ticksにて設定しています。また、こちらもバージョン3.9.1と同様に、X軸の目盛りが回転しているため、maxRotationを設定する必要があります。
// バージョン4.4.4の場合
scales: {
  x: {
    min: new Date("2024/07/31"),
    max: new Date("2024/09/01"),
    ticks: {...}
  },
  y: {
    min: yMinRange,
    max: yMaxRange,
    ticks: {
      count: 21
    }
  }
}

// バージョン2.9.4の場合、ticksで最小、最大値を決定する
scales: {
  xAxes: [{
    ticks: {
      min: new Date("2024/07/31"),
      max: new Date("2024/09/01"),
      maxRotation: 0;
    }
  }],
  yAxes: [{
    ticks: {
      stepSize: 1
      min: yMinRange,
      max: yMaxRange,
    }
  }]
}
X軸、Y軸タイトル(単位)
バージョン4.4.4ではtitleに、バージョン2.9.4ではscaleLabelにて、軸に名前をつけられます。また、文字の指定する際にも、渡すパラメータ名が異なる差分があります。また、文字の位置を2.9.4では指定できませんでした。
// バージョン4.4.4の場合
x: {
  title: {
    align: 'end',
    text: '日'
  }
}

// バージョン2.9.4では、scaleLabelに設定する、またラベルの位置は変更できない
xAxes: [{
  scaleLabel: {
    labekString: '日'
  }
}]
チャートから取得できる位置とサイズ情報
これは追加したpluginsのchartAreaBorderで使用しているctx変数の話になります。バージョン4.4.4では、chart.ctxとchart.chartAreaから値を取得しています。この時、chartAreaのleft, top, width, heightの4つのパラメータを取得しています。 バージョン2.9.4でも同様に、chart.ctxとchart.chartAreaから値を取得しますが、chart.chartAreaには、widthとheightの変数が消えているため、rightやbottomからwidth, heightを算出しています。
// バージョン4.4.4の場合、高さと幅を直接取得できる
const chartAreaBorder = {
  id: 'chartAreaBorder',
  afterDraw(chart, args, options) {
    const {ctx, chartArea: {left, top, width, height}} = chart;
    ctx.save();
    ctx.strokeStyle = options.borderColor;
    ctx.lineWidth = options.borderWidth;
    ctx.strokeRect(left, top, width, height);
    ctx.restore();
  }
}

// バージョン2.9.4では、rightとbottomを使用して、高さと幅の値を取得している
const chartAreaBorder = {
  id: 'chartAreaBorder',
  afterDraw(chart, args, options) {
    const {ctx, chartArea: {bottom, left, right, top}} = chart;
    ctx.save();
    ctx.strokeStyle = options.borderColor;
    ctx.lineWidth = options.borderWidth;
    ctx.strokeRect(left, top, right - left, bottom - top);
    ctx.restore();
  }
};
以上が4.4.4と2.9.4の差分になります。この差分の修正をすると、Chart.js2.9.4であっても、同様のグラフを作成できます。

終わりに
今回はChart.jsのバージョンごとの差分を書き出しました。バージョン2.Xから4.Xにかけて、差分が大きくなり、他のサイトをバージョンを合わせないと他のサイトを参考にしながらというのも難しくなります。
今回の解説で、バージョンによる問題でChart.jsが上手く動作しない場合の助けになれたらと思います。ほか、バージョンアップの参考にもしていただけたら幸いです。
CONTACT
お問い合わせ・ご依頼はこちらから
