MAGAZINE
ルーターマガジン
Chart.jsで東京の夏の気温データをグラフ化するチュートリアル

はじめに
こんにちは、エンジニアのmiyakawaです。
データを視覚的に伝える際、最も効果的な方法の一つがグラフです。ルーターが提供する「アドクロール」でも、データをグラフ形式で表示しています。
Web上でグラフを描画する際、いろいろなJavaScriptのライブラリがあります。そのうちの1つにChart.jsというライブラリがあります。Chart.jsはデータがあれば、Web上に比較的容易にグラフを描画できます。
今回は気象庁のホームページに掲載された気温データを使い、Chart.jsを用いてHTML上でグラフ化する手順を解説します。
使用するChart.jsのバージョン
本ブログではChart.jsは以下のバージョンを使用します。
- 4.4.4
実装前の準備
まずはChart.jsライブラリをHTMLで使用できるように呼び出しましょう。今回はCDNでChart.jsを呼び出します。以下のリンク先にあるscriptタグをHTMLにコピペして使用してください。
また、Chat.jsでは日付データなどを扱うJavaScriptライブラリと連携できる機能があります。
今回グラフの横軸には日付を扱いますので、時間を扱うJavaScriptライブラリ、及び、ライブラリとChart.jsを連携する機能もCDNで呼び出します。今回はluxonというライブラリを使用していきます。
作成するグラフ
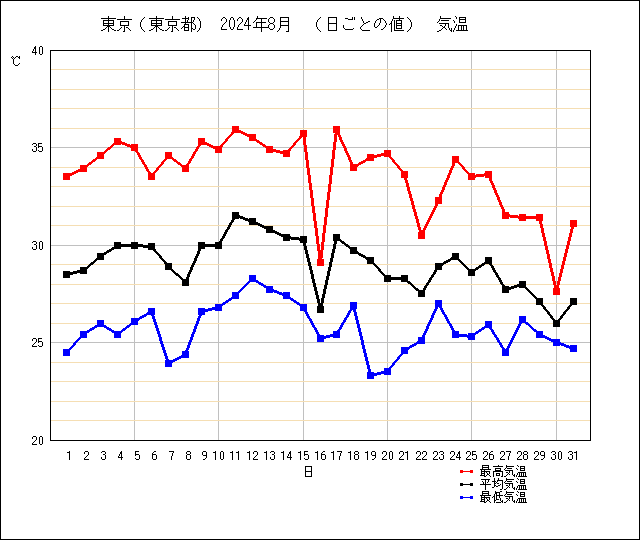
ここでは、気象庁のホームページから、東京の2024年8月の日ごとの気温グラフ^1を作ることを目標とします。

バージョン4.4.4でグラフ描画に必要なChart.jsの構造
東京の2024年8月の日ごとの気温グラフを作成する場合に、Chart.jsバージョン4.4.4では、以下のHTMLとJavaScriptのコードで書けます。
<div style="width: 640px; height: 540px;">
  <canvas id="temprature-chart"></canvas>
</div>
<script>
  const ctx = document.getElementById('temprature-chart').getContext('2d');
  const tempratureChart = new Chart(ctx, {
    type: 'line',
    data: {
      labels: dateLabels,
      datasets: tampratureDatasets
    },
    options: {
      maintainAspectRatio: false,
      plugins: {
        title: titleOption,
        legend: legendOption
      },
      scales: {
        x: {
          type: 'time',
          time: xTime
          min: xMIN,
          max: xMax,
          grid: xGrid,
          ticks: xTicks,
          title: xUnit
        },
        y: {
          min: yMinRange,
          max: yMaxRange,
          grid: yGrid
          ticks: yTicks,
          title: yUnit
        },
      },
      chartAreaBorder: chartAreaBorderOptions
    },
    plugins: [
      chartAreaBorder
    ]
  });
</script>
特に、Chart.jsは基本的に3つ+αの構造に分かれています。
type- グラフの種類を設定
data- グラフデータとグラフ要素の設定
options- グラフレイアウトの設定などに対応できる
plugins- Chart.jsに拡張機能を追加できる
それぞれ使用している構造が、Chart.jsではどのように動作しているかを説明していきます。
type:グラフの種類の設定
typeはグラフの種類を設定します。type = 'line'とすることで、描画するグラフを折れ線グラフを設定しています。
data:グラフデータとグラフ要素の設定
dataはグラフを描画するデータを設定します。
dataにはlabels(x軸)とdatasets(描画するグラフ要素)に対応する値を渡します。
labelsの作成
今回作成するグラフのX軸のlabelsには8月の日付の配列を作成します。グラフのx軸には日付のみを表示するように`labelsを決定します。
let datelist = ["2024/08/01" ,"2024/08/02" ,"2024/08/03" ,"2024/08/04" ,"2024/08/05" ,"2024/08/06" ,"2024/08/07" ,"2024/08/08" ,"2024/08/09" ,"2024/08/10" ,"2024/08/11" ,"2024/08/12" ,"2024/08/13" ,"2024/08/14" ,"2024/08/15" ,"2024/08/16" ,"2024/08/17" ,"2024/08/18" ,"2024/08/19" ,"2024/08/20" ,"2024/08/21" ,"2024/08/22" ,"2024/08/23" ,"2024/08/24" ,"2024/08/25" ,"2024/08/26" ,"2024/08/27" ,"2024/08/28" ,"2024/08/29" ,"2024/08/30" ,"2024/08/31"];
const dateLabels = dateList.map((date) => new Date(date));
datasetsの作成
datasetsは最高気温、最低気温、平均気温の3つのデータを格納したobjectを渡す必要があります。
初めにそれぞれの日ごとの気温データを気象庁ホームページからダウンロードしたものを用意します。
let dateMaxTemprature = [33.5, 33.9, 34.6, 35.3, 35, 33.5, 34.6, 33.9, 35.3, 34.9, 35.9, 35.5, 34.9, 34.7, 35.7, 29.1, 35.9, 34, 34.5, 34.7, 33.6, 30.5, 32.3, 34.4, 33.5, 33.6, 31.5, 31.4, 31.4, 27.6, 31.1];
let dateMinTemprature = [24.5, 25.4, 26, 25.4, 26.1, 26.6, 23.9, 24.4, 26.6, 26.8, 27.4, 28.3, 27.7, 27.4, 26.8, 25.2, 25.4, 26.9, 23.3, 23.5, 24.6, 25.1, 27, 25.4, 25.3, 25.9, 24.5, 26.2, 25.4, 25, 24.7];
let dateAverageTemprature = [28.5, 28.7, 29.4, 30, 30, 29.9, 28.9, 28.1, 30, 30, 31.5, 31.2, 30.8, 30.4, 30.3, 26.7, 30.4, 29.7, 29.2, 28.3, 28.3, 27.5, 28.9, 29.4, 28.6, 29.2, 27.7, 28, 27.1, 26, 27.1];
次にdatasetsとなるobjectを作成します。
const tampratureDatasets = [{
  label: '最高気温',
  data: dateMaxTemprature,
  borderColor: 'red',
  backgroundColor: 'red',
  pointStyle: 'rect',
  tension: 0.02
},
{
  label: '最低気温',
  data: dateMinTemprature,
  borderColor: 'blue',
  backgroundColor: 'blue',
  pointStyle: 'rect',
  tension: 0.02
},
{
  label: '平均気温',
  data: dateAverageTemprature,
  borderColor: 'black',
  backgroundColor: 'black',
  pointStyle: 'rect',
  tension: 0.02
}];
object内にはいくつかパラメータを渡して、グラフ要素のレイアウトを変更できます。
上記コードで設定しているパラメータの説明をしていきます。
label- グラフ要素の名前
data- グラフに表示したいデータを格納
borderColor- 折れ線の色を設定
backgroundColor- グラフ要素の内部色を設定
pointStyle- グラフの点(マーカー)のレイアウトを変更する
'rect'の場合は四角形
tension- 値を大きくすると曲線に、0に近づけると直線になります。
このデータを使用することで、グラフの描画自体は完了になります。
optionsによるレイアウト設定
optionsはグラフの目盛り線や凡例などのレイアウトを調整することができます。
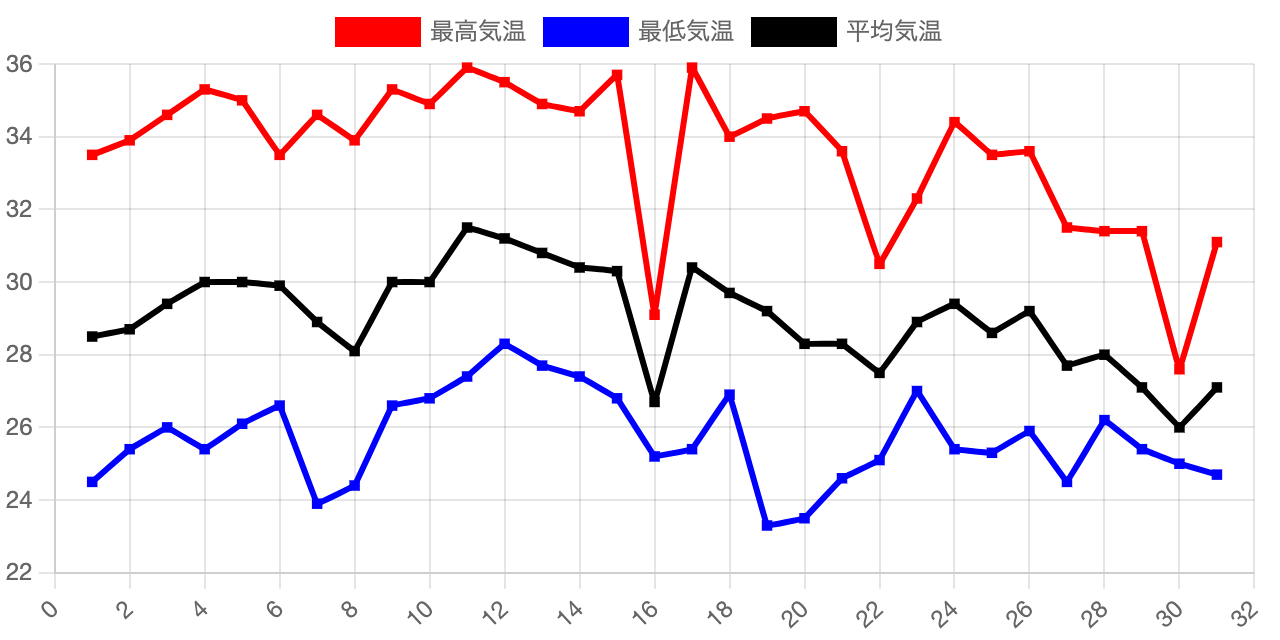
以下、optionsを設定しない場合でグラフを描画する場合になります。

グラフとしては最低限の情報を持っています。しかし、デザインを変更して、より見せやすいデータを作成するに越したことはありません。では実際に
optionsを設定の説明をします。
maintainAspectRatio
Chart.jsで描画されるグラフの幅や高さを設定する際、canvasタグの親タグの幅や高さを設定します。ただ、Chart.jsではデフォルトでアスペクトを維持するオプションmaintainAspectRatioが存在します。
こちらはデフォルトでは、横2:縦1に設定されており、横幅を決定したら、縦幅をデフォルトのアスペクト比に合わせるに高さが決定されます。
maintainAspectRatio: falseとすることで、アスペクト比を維持せず、canvasタグの親タグの幅や高さに合わせてグラフが描画されます。
plugins
デフォルトで提供されている機能(タイトル、凡例、ツールチップ)や、自作の拡張機能を、オプションとして追加設定できます。
plugins: {
  title: titleOption,
  legend: legendOption
},
デフォルトで設定できる、グラフタイトルと凡例のオプションを設定していきます。
グラフタイトルの設定
Chart.jsではグラフのタイトルをデフォルトでは表示しない設定になっています。表示するには以下のタイトルオプションの設定値ようにdisplayをtrueにする必要があります。
titleOption = {
  display: true,
  text: "東京(東京都)2024年8月(日ごとの値)気温",
  font: {
    size: 20
  }
}ここで、textはタイトルの文面の設定になります。
凡例の設定
legendにパラメータを与えることで、凡例のレイアウトを変更可能になります。
legendOption = {
  position: 'bottom',
  align: 'end',
  labels: {
    usePointStyle: true,
    pointStyle: 'rect'
  }
}positionは凡例を上下左右のどこに配置するか、alignは下の場合、グラフの左、真ん中、右のどこに配置するかを設定できます。
labelsのusePointStyleをtrueに、 pointStyleをrectに設定することで、グラフのマーカーと同じ形に変更しています。
scalses
scalesはグラフの目盛りや目盛り線の感覚などを設定することが可能です。scales配下にて、x軸とy軸に分けて設定できます。
scales: {
  x: {
    type: 'time',
    time: xTime
    min: xMIN,
    max: xMax,
    grid: xGrid,
    ticks: xTicks,
    title: xUnit
  },
  y: {
    min: yMinRange,
    max: yMaxRange,
    grid: yGrid
    ticks: yTicks,
    title: yUnit
  },
},
x軸とy軸に設定しているパラメータを説明していきます。
x軸にのみ、type: 'time'を指定しています。指定することで、時間を扱ったグラフを作成するように使用できます。
また、timeには時間の軸をどのように表示するかを調整できます。
xTime = {
  unit: 'day',
  displayFormats: {
    day: 'd'
  }
},ここで、unitとはデータの単位を決定する機能になります。ここでは'day'としているため、日ごとにデータを表示できます。また、displayFormatsとは画面上に表示する時間の軸ラベルの共通名を決定する機能になります。
minとmaxはそれぞれ、グラフの最小値と最大値の範囲になります。以下、それぞれの設定値です。
const xMIN = new Date("2024-07-31");
const xMax = new Date("2024-09-01");
const yMinRange = 20;
const yMaxRange = 40;gridはグラフの格子線を設定できます。ticksは目盛りを設定でき、titleはそれぞれの軸に名前を表示する機能です。
格子線のレイアウトは以下のように変更しています。
const xGrid = {
  drawTicks: false,
  lineWidth: 2
};
const yGrid ={
  drawTicks: false,
  color: function(tick) {
    return tick['tick']['value'] % 5 == 0 ? Chart.defaults.borderColor : 'orange';
  },
  lineWidth: function(tick) {
    return tick['tick']['value'] % 5 == 0 ? 2 : 1;
  },
};drawTicksは目盛り線を表示するかしないかを設定できます。colorは格子線の色を、lineWidthは格子線の太さを設定できます。またyGridのcolorやlineWidthは関数を用いて個別に設定できます。
目盛りのレイアウトは以下のように設定しています。
const xTicks = {
  maxTicksLimit: 7,
};
const yTicks ={
  count: 21,
  callback: function(value, index, ticks) {
    return value % 5 == 0 ? value : '';
  }
};目盛りの設定をする際、x軸ではmaxTicksLimitというものを設定しています。これは、目盛り線を最大でいくつ出すかを設定する機能です。いくつ目盛り線を出すかまで決められて、どこを目盛り線とするかは、設定出来ませんので、レイアウトが良くなるように、最小値、最大値を設定する必要があります。
y軸では表示される範囲で、どのくらい目盛り線を表示するかを決定すつcountを使用しています。また、表示するデータとしないデータを選択するために、callbackを使用しています。callbackを使用することで、軸の値をどのように表示するかを設定出来ます。
最後にtitleの設定を説明していきます。これは軸に名前をつける機能になります。ここでは単位を表示するためにtitleを使用しています。
{
  const xUnit = {
    display: true,
    text: '日'
  };
  const yUnit = {
    display: true,
    align: 'end',
    text: '℃'
  };
}軸名を表示するには、display: trueと指定する必要があります。alignで軸タイトルをどこに配置するか決定しています。
pluginsによる拡張機能の追加
最後にoptionsには用意されていない変更を行う際、拡張機能を追加する時にpluginsを使用することで拡張機能を導入できます。拡張機能は他人が作成したものや自作したものを用いて、Chart.jsで実現できることの幅を広げます。
今回はchartAreaBorderという拡張機能を使用して、グラフを枠で囲います。以下、追加する拡張機能のスクリプトです。
const chartAreaBorder = {
  id: 'chartAreaBorder',
  beforeDraw(chart, args, options) {
    const {ctx, chartArea: {left, top, width, height}} = chart;
    ctx.save();
    ctx.strokeStyle = options.borderColor;
    ctx.lineWidth = options.borderWidth;
    ctx.setLineDash(options.borderDash || []);
    ctx.lineDashOffset = options.borderDashOffset;
    ctx.strokeRect(left, top, width, height);
    ctx.restore();
  }
};上記の拡張機能をChart.jsに適応させるには、pluginsにchartAreaBorderを追加します。
plugins: [
  chartAreaBorder
]最後に追加した、拡張機能に必要パラメータをoptions配下のpluginsに追加することで描画できます。
chartAreaBorderOptions = {
  borderColor: 'black',
  borderWidth: 2,
  borderDash: [],
  borderDashOffset: null,
}
完成したグラフ
以下、全てのパラメータを追加したHTMLになります。
<!DOCTYPE html>
<html>
  <head>
    <script src="https://cdn.jsdelivr.net/npm/chart.js@4.4.4/dist/chart.umd.min.js"></script>
    <script src="https://cdn.jsdelivr.net/npm/luxon@3.5.0/build/global/luxon.min.js"></script>
    <script src="https://cdn.jsdelivr.net/npm/chartjs-adapter-luxon@1.3.1/dist/chartjs-adapter-luxon.umd.min.js"></script>
    <script>
      const dateList = ["2024/08/01" ,"2024/08/02" ,"2024/08/03" ,"2024/08/04" ,"2024/08/05" ,"2024/08/06" ,"2024/08/07" ,"2024/08/08" ,"2024/08/09" ,"2024/08/10" ,"2024/08/11" ,"2024/08/12" ,"2024/08/13" ,"2024/08/14" ,"2024/08/15" ,"2024/08/16" ,"2024/08/17" ,"2024/08/18" ,"2024/08/19" ,"2024/08/20" ,"2024/08/21" ,"2024/08/22" ,"2024/08/23" ,"2024/08/24" ,"2024/08/25" ,"2024/08/26" ,"2024/08/27" ,"2024/08/28" ,"2024/08/29" ,"2024/08/30" ,"2024/08/31"];
      const dateLabels = dateList.map( (date) => new Date(date));
      let dateMaxTemprature = [33.5, 33.9, 34.6, 35.3, 35, 33.5, 34.6, 33.9, 35.3, 34.9, 35.9, 35.5, 34.9, 34.7, 35.7, 29.1, 35.9, 34, 34.5, 34.7, 33.6, 30.5, 32.3, 34.4, 33.5, 33.6, 31.5, 31.4, 31.4, 27.6, 31.1];
      let dateMinTemprature = [24.5, 25.4, 26, 25.4, 26.1, 26.6, 23.9, 24.4, 26.6, 26.8, 27.4, 28.3, 27.7, 27.4, 26.8, 25.2, 25.4, 26.9, 23.3, 23.5, 24.6, 25.1, 27, 25.4, 25.3, 25.9, 24.5, 26.2, 25.4, 25, 24.7];
      let dateAverageTemprature = [28.5, 28.7, 29.4, 30, 30, 29.9, 28.9, 28.1, 30, 30, 31.5, 31.2, 30.8, 30.4, 30.3, 26.7, 30.4, 29.7, 29.2, 28.3, 28.3, 27.5, 28.9, 29.4, 28.6, 29.2, 27.7, 28, 27.1, 26, 27.1];
    </script>
    <script>
      titleOption = {
        display: true,
        text: "東京(東京都)2024年8月(日ごとの値)気温",
        font: {
          size: 20
        }
      };
      legendOption = {
        position: 'bottom',
        align: 'end',
        labels: {
          usePointStyle: true,
          pointStyle: 'rect'
        }
      };
      const yMinRange = 20;
      const yMaxRange = 40;
      const xGrid = {
        drawTicks: false,
        lineWidth: 2
      };
      const xTicks = {
        maxTicksLimit: 7,
      };
      const xUnit = {
        display: true,
        text: '日'
      };
      const yGrid ={
        drawTicks: false,
        color: function(tick) {
          return tick['tick']['value'] % 5 == 0 ? Chart.defaults.borderColor : 'orange';
        },
        lineWidth: function(tick) {
          return tick['tick']['value'] % 5 == 0 ? 2 : 1;
        },
      };
      const yTicks ={
        count: 21,
        callback: function(value, index, ticks) {
          return value % 5 == 0 ? value : '';
        }
      };
      const yUnit = {
        display: true,
        align: 'end',
        text: '℃'
      };
      chartAreaBorderOptions = {
        borderColor: 'black',
        borderWidth: 2,
        borderDash: [],
        borderDashOffset: null,
      };
    </script>
    <script>
      const chartAreaBorder = {
        id: 'chartAreaBorder',
        afterDraw(chart, args, options) {
          const {ctx, chartArea: {left, top, width, height}} = chart;
          ctx.save();
          ctx.strokeStyle = options.borderColor;
          ctx.lineWidth = options.borderWidth;
          ctx.strokeRect(left, top, width, height);
          ctx.restore();
        }
      };
    </script>
  </head>
  <body>
    <div style="width: 640px; height: 540px;">
      <canvas id="weather-chart"></canvas>
    </div>
    <script>
      const ctx = document.getElementById('weather-chart').getContext('2d');
      const weatherChart = new Chart(ctx, {
        type: 'line',
        data: {
          labels: dateLabels,
          datasets: [
            {
              label: '最高気温',
              data: dateMaxTemprature,
              borderColor: 'red',
              backgroundColor: 'red',
              pointStyle: 'rect',
              tension: 0.02
            },
            {
              label: '最低気温',
              data: dateMinTemprature,
              borderColor: 'blue',
              backgroundColor: 'blue',
              pointStyle: 'rect',
              tension: 0.02
            },
            {
              label: '平均気温',
              data: dateAverageTemprature,
              borderColor: 'black',
              backgroundColor: 'black',
              pointStyle: 'rect',
              tension: 0.02
            }]
        },
        options: {
          maintainAspectRatio: false,
          plugins: {
            title: titleOption,
            legend: legendOption,
            chartAreaBorder: chartAreaBorderOptions
          },
          scales: {
            x: {
              type: 'time',
              time: {
                unit: 'day',
                displayFormats: {
                  day: 'd'
                }
              },
              min: new Date("2024/07/31"),
              max: new Date("2024/09/01"),
              grid: xGrid,
              ticks: xTicks,
              title: xUnit
            },
            y: {
              min: yMinRange,
              max: yMaxRange,
              grid: yGrid,
              ticks: yTicks,
              title: yUnit
            },
          },
        },
        plugins: [
          chartAreaBorder
        ]
      });
    </script>
  </body>
</html>
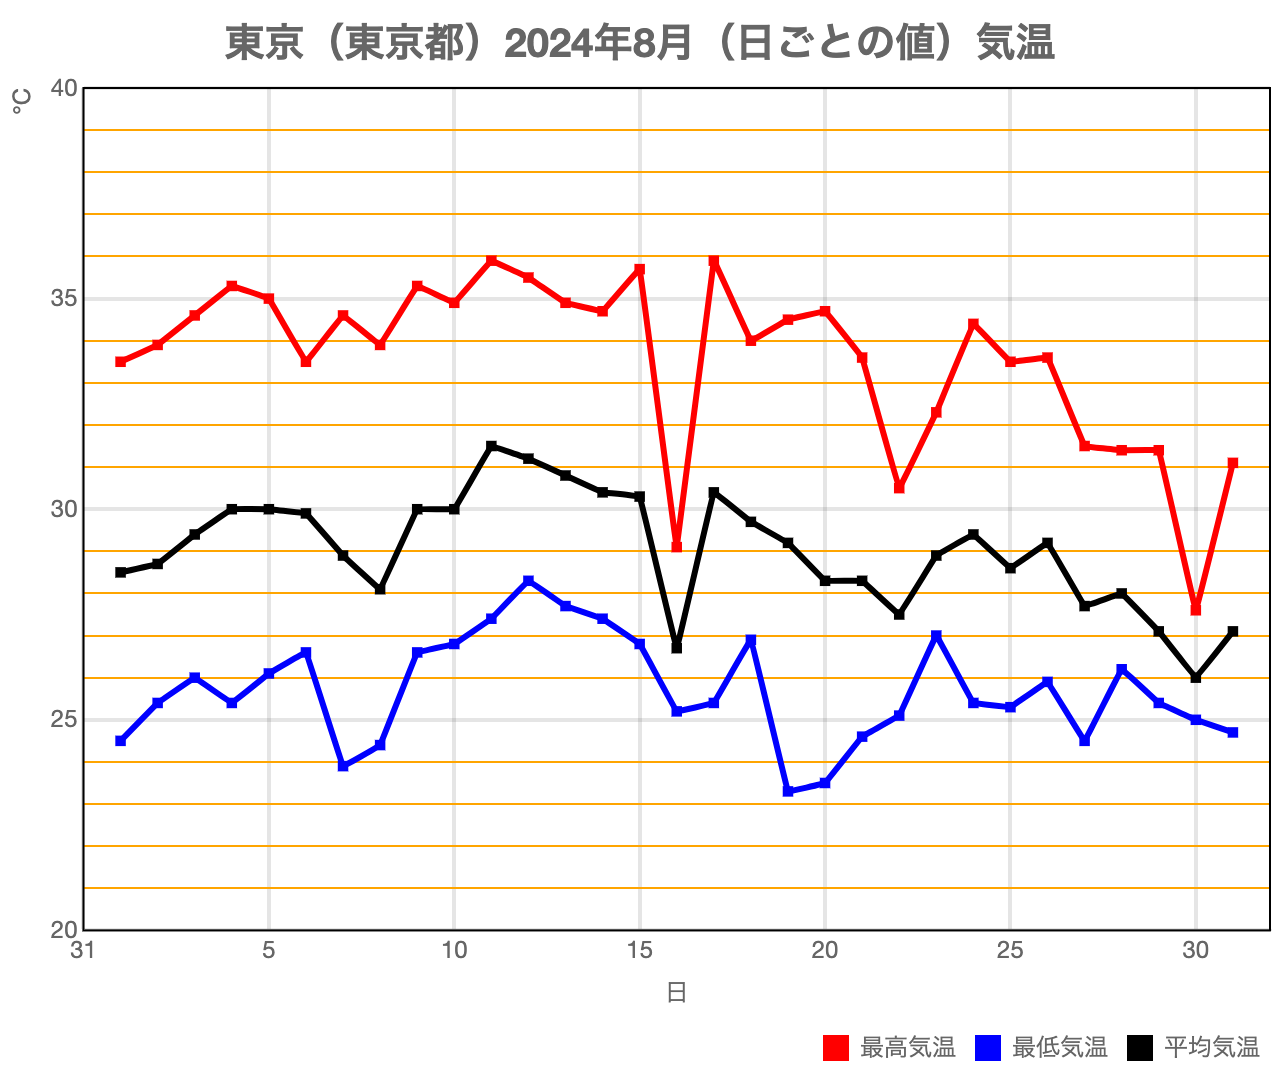
以下のHTMLでは次図のグラフを描画します。

このようにWeb上でもChart.jsを用いることで、実用的なグラフを作成することができます。
終わりに
Web上でグラフを描画できるライブラリ。Chart.jsを用いることで、Web上にデータを渡すだけでグラフを描画することができます。ぜひ皆様もChart.jsを使用してWeb上にグラフを描画していてください。
出典
- 「東京(東京都)2024年8月(日ごとの値)気温」(気象庁ホームページより)
CONTACT
お問い合わせ・ご依頼はこちらから
